Monday, August 31, 2009

 A Special Hunting Map on NHPC

Hi Friends

So the IPO which is named as NHPC is getting listed on the 1st of September 2009, a brief information which can be useful for traders and investors on the Stock.

National Hydroelectric Power Corporation is one of the largest organisation for hydro-power development in India having constructed 13 hydro-power projects in India and abroad with a total installed capacity of 3694.35 MW (Including the projects under joint venture). With an asset value of Rs. 2,00,000 million NHPC has planned to add 2480 MW of power during Xth plan and 6297 MW of power during XIth plan. NHPC's capabilities include the complete spectrum of hydropower development from concept to commissioning.


Presently, They are engaged in the construction of 11 additional hydroelectric projects, which are expected to increase total installed capacity by 4,622 MW. Further eight projects, including one joint venture project, with an anticipated capacity of 5,751 MW, are currently awaiting sanction from the CCEA. NHPC have obtained ISO 18001:2000, ISO 9001:2000 and ISO 14001:2004 certifications from the Bureau of Indian Standards

(Info found from google)

The opening date of the IPO was on the 7th of August and the issue was closed on the 12th of August, the IPO was very well over subscribed.

So now is the time when the IPO is going to come out and get listed in the market, tomorrow the 1st of September is the day when the IPO is getting listed, the IPO is likely to open at a premium, we are expecting the IPO to list around 41 - 43 levels and then some high moves can be sen around 46 levels and we may also see some profit booking so be careful at high levels.

A warning for all the traders, the stock is a good accumulation around 30 - 36 levels, so one can sell the stock at high levels and get it hold back at around lower levels.

For investors, this stock, can be a multi-bager and one having a long view on the stock for 1 - 2 years can touch pecks which no one expected, in a time frame of 1 year this stock can double and if one holds more than 2 years then one can see the stock at 120 - 150 levels also.

If we look at the allotment,, it was done on this basis : -

NHPC IPO Allotment Details

Share Applied

Allotment

Ratio

175

175

14 : 51

350

175

6 : 11

525

175

9 : 11

700

180

Firm Allotment

875

238

Firm Allotment

1050

285

Firm Allotment

1225

333

Firm Allotment

1400

380

Firm Allotment

1575

428

Firm Allotment

1750

476

Firm Allotment

1925

523

Firm Allotment

2100

571

Firm Allotment

2275

618

Firm Allotment

2450

666

Firm Allotment

2625

713

Firm Allotment


So those investors who didn't get hold of the stock, would try to buy the stock at dips and thus it could be a hard time for the traders to trade in the stock, so one has a call to book at high levels and buy at dips or wait for more up moves and wait for few days and see the moves and react to it accordingly.

One can see 46 - 50 - 55 levels in the coming months, so this might help you take decisions accordingly.
In the coming years, this stock is likely to get many good news which would help the stock to boost up and sooner or later the stock would be added in the future section, which can be a very positive news for the stock and the execution of the projects would also help the stock to boost up. For a long term view on the stock is very positive.

Fundamentally the company is very strong and this stock is likely to out perform in the coming years, a very good IPO after a long time, and can be a high return low risk share.

One can make there own decisions, the above mentioned information is for educational purpose only and make final decisions after consulting there financial advisers, the above mentioned information are our personal views.

Regards

Captain
www.moneybaghunting.blogspot.com

 Treasure Hunting Map (Stocks)

Hi Friends


The Stocks which we have short listed for the coming session and the last day of the week are as follows : -

Reliance Industries

Buy above 2034 - 2047 - 2069 SL - 2022

Sell below 2000 - 1978 - 1965 SL - 2018

Bharti Airtel

Buy above 430 - 434 - 439 SL - 426

Sell below 421.80 - 416 - 412 SL - 427

Ivrcl Infra

Buy above 367 - 371 - 375 SL - 364

Sell below 359.75 - 355 -.67 - 352.05 SL - 365

IFCI

Buy above 56.65 - 57.70 - 58.35 SL - 55.20

Sell below 54.95 - 54.30 - 53.25 SL - 55.95

Unitech

Buy above 108 - 112 - 114 SL - 105

Sell below 102 - 99.67 - 95.83 SL - 106

These are the stock which we have short listed for the session and one can hunt these stocks in options and even in future, they can trade with appropriate stop loss and trade in the session.

Disclaimer : -

The above stocks are my personal views, one may see that trading in the market involves risk and thus one may trade in the stocks at there own risk, we won't hold any responsibility.

Regards

Treasure Captain
www.moneybaghunting.blogspot.com

 Treasure Hunting Map (Nifty)

Hi Friends,

After the gap down opening and slipping of China Index created a black cloud over the Asia indexes, in the opening bell Hang Sang was trading in red but the Nikkie index was holding and trading in green, but a thunder storm was formed on all indexes and the markets starts slipping more and soon we saw the Nikkie index trading in red.

In the opening bell we saw a gap down signal as per the SGX Nifty, but nifty at the opening bell opened around 4730.85, just near to the previous close and at the very crucial level, but after the opening bell we saw some slipping from higher levels.

Soon after the opening bell and the china slipping, it drag all the indexes with it and the china closing we saw an 6.5% down side.

Nifty has to cross 4730 levels to test much higher levels and a brake below 4550 levels can make nifty test 4350 levels and if this time 4350 levels are broken then we might test 3950 levels and if those levels are broken then the gap which has to be filled created at the time of the circuit would be filled, thats a long term view, as of now to cut it short keep eyes on 4550 and 4730 levels.

If we look at the charts of Nifty : -

Sell of was seen after many session of buying, crude oil is also under correction and the commodities sector are the major draggers which are cracking the world wide markets.
We had seen some recovery from lower levels, after a major sell off which indicates that people took the correction as an oppurunity to buy at dips and one can create long positions with stop loss of 4550 levels and can exit at highs only when we cross 4730 levels, tomorrow is also a day for NHPC, the IPO is going to get listed, so d

Hunting Map on Nifty can be : -

Buy above 4696 - 4716 - 4744 - 4771 SL - 4680

Sell below 4648 - 4621 - 4600 - 4580 SL - 4675

We would like to wish all the Pirates a very all the BEST.

Disclaimer : -

The above stocks are my personal views, one may see that trading in the market involves risk and thus one may trade in the stocks at there own risk, we won't hold any responsibility.

Regards

Treasure Captain
www.moneybaghunting.blogspot.com

Sunday, August 30, 2009

 Treasure Hunting Map (Stocks)

Hi Friends


The Stocks which we have short listed for the coming session and the last day of the week are as follows : -

Ivrcl Infra

Buy above 364 - 367 - 370 SL - 361

Sell below 360 - 359 - 356 SL - 363

Reliance Industries

Buy above 2077 - 2094 - 2104 SL - 2068

Sell below 2050 - 2039 - 2022 SL 2060

Unitech

Buy above 99.38 - 101.42 - 102.58 SL - 97.50

Sell below 96.18 - 95.02 - 92.98 SL - 98.20


These are the stock which we have short listed for the session and one can hunt these stocks in options and even in future, they can trade with appropriate stop loss and trade in the session.

Disclaimer : -

The above stocks are my personal views, one may see that trading in the market involves risk and thus one may trade in the stocks at there own risk, we won't hold any responsibility.

Regards

Treasure Captain
www.moneybaghunting.blogspot.com

 Treasure Hunting Map (Nifty)

Hi Friends

S hope all had a nice weekend, nifty made a tremendous move on the last day of the session in the last week, nifty almost made an high of 4743.75 in the cash market, and we saw a very volatile session.

As we had said in our previous articles and charts indicators which were marked, we saw accumalation in the past trading sessions and a clear cut brake out was to be seen on above 4720 levels, which was said in our articles, and the result was in front of you all, we saw a new high in the year 2009 but our indexes.

Now for the bull run to continue one can make a note that, if we have positive global ques then we can see much higher levels, but a close above 4750 levels that to with volumes then we can see much higher levels, or a close below 4710 levels, we may see some correction and the fight between the bulls and the bears may continue.

But make it a note that if we see some correction in the market and not brake 4550 on closing basis then one can take this opportunity as a buy on dips strategy and keep a strict stop loss at 4550.

So if one can see nifty around 4600 or so levels take a buy signal and buy it with the stop loss which was mentioned above, only close below 4550 was change the trend of the market and we may see some heavy correction after a sharp up move which has been seen and yet to be seen in the up coming sessions.

For the hunting session the map is as follows : -

Check out the map, heavy accumulation has been seen as the past sessions from the dips.

One can

Buy nifty above 4738 - 4766 - 4784 - 4801 SL - 4710

Sell below 4691 - 4674 - 4645 - 4616 - 4599 SL - 4720

For the week, Nifty has to close above 4750 levels that to two times regularly to indicate that the bull run and we can test more up sides, other wise, a crack may be seen and this may act as a trap for the coming sessions.

We would like to wish all the Pirates a very all the BEST.

Disclaimer : -

The above stocks are my personal views, one may see that trading in the market involves risk and thus one may trade in the stocks at there own risk, we won't hold any responsibility.

Regards

Treasure Captain
www.moneybaghunting.blogspot.com

Thursday, August 27, 2009

 Treasure Hunting Map ( Stocks )

Hi Friends

The Stocks which we have short listed for the coming session and the last day of the week are as follows : -

Ivrcl Infra


Buy above 364 - 368 - 371.50 SL - 360

Sell below 360.70 - 358 - 354.50 SL - 363

Reliance Industries


Buy above 2050 - 2060 - 2070 SL - 2043

Sell below 2031 - 2021 - 2011 SL - 2038

Larsen & Turbo


Buy above 1604 - 1624 - 1636 SL - 1592

Sell below 1585 - 1572 - 1560 SL - 1595

These are the stock which we have short listed for the session and one can hunt these stocks in options and even in future, they can trade with appropriate stop loss and trade in the session.

Disclaimer : -

The above stocks are my personal views, one may see that trading in the market involves risk and thus one may trade in the stocks at there own risk, we won't hold any responsibility.

Regards

Treasure Captain
www.moneybaghunting.blogspot.com

 Treasure Hunting Map ( Nifty )

Hi Friends,

Today was the last session of the Expiry for the month of August, from tomorrow a new session is going to start for the month of September, the opening bell for the month would decide the rest of the trend for the whole months session, so one shouldn't take any fast moves, and one must be careful now at high levels, no fresh positions are suggested to be taken at these levels.

We would again like to remind you of the note that, for the up trend to continue one has to see nifty closing above 4730 levels, other wise fresh short positions can be created, as per the volumes of the end of the session were impressive and the upside and control for the bulls would be only above 4730 levels, so one can make fresh positions only above the range brake out.

If we brake 4730 then bulls and if not then the control is in the hands of the bears and we may see some correction in the coming week before making any upsides, if we look at the chart of Nifty we would find some impressive hidden hints : -


One can make fresh short positions with strict stop loss at 4730 levels for the target of 4550 and if we brake 4520 on closing basis we might test the old levels which are 4350 levels and then the new trend would be printed in the up coming sessions, this is a view for short term and if we look at the session which is tomorrow one can trade as follows : -

Buy above 4698 - 4715 - 4729 - 4743 - 4760 SL - 4680

Sell below 4670 - 4666 - 4652 - 4635 - 4617 SL - 4685

As we had warned in our previous blog that nifty expiry would be around 4655 levels, the levels were not exact, but the trend was intact and we closed the expiry below 4700 levels.

So again we have provided a warning, so be careful :).

So one needs to be careful and trade in small quantity. One should also follow strict stop loss in there hunting.

We would like to wish all the Pirates a very all the BEST.

Disclaimer : -

The above stocks are my personal views, one may see that trading in the market involves risk and thus one may trade in the stocks at there own risk, we won't hold any responsibility.

Regards

Treasure Captain
www.moneybaghunting.blogspot.com

Wednesday, August 26, 2009

 Treasure Hunting Map ( Stocks )

Hi Friends

The stocks which we have short listed for the ending session of the month are as follows : -

Aban Off Shore


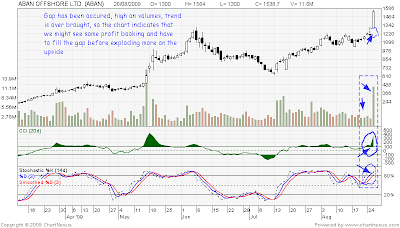
Aban off shore a stock performer for the day, the company got some good bags of gold thus the stock out performed in the session, but the big question which arrases now is that is anything left now or fresh shorts can be created, we have the question answer with us here is the map : -

Buy aban above 1551 - 1635 - 1683 SL - 1520

Sell below 1470 - 1419 - 1371 SL - 1510

Reliance Industries LTD


Buy above 2043 - 2054 - 2061 SL - 2030

Sell below 2025 - 2018 - 2007 SL - 3036

IFCI Ltd

Buy above 52.50 - 52.85 - 53.43 SL - 51.80

Sell below 51.60 - 51 - 50.65 SL - 52.15

IVRCL Infra


Buy above 369 - 372 - 377 SL - 365

Sell below 361 - 356 - 353 SL - 366

These are the stock which we have short listed for the session and one can hunt these stocks in options and even in future, they can trade with appropriate stop loss and trade in the session.

Disclaimer : -

The above stocks are my personal views, one may see that trading in the market involves risk and thus one may trade in the stocks at there own risk, we won't hold any responsibility.

Regards

Treasure Captain
www.moneybaghunting.blogspot.com

 Treasure Hunting Map ( NIFTY )

Hi Friends

So all set for the last session of the month, as per the 27th of August has arrived and we are going see the session expiry tomorrow, we would like to cut it short, if we look at the charts of Nifty, we would find it very interesting, as per the upside may come to an end and after the expiry, we may go back to the red side of the market and the bulls and bears may go on a war again and then after words we would see the clear market trend, as of now for tomorrow the charts show : -

We have pin pointed some important levels and trends in nifty.

If we look at the close for today, we have seen that nifty has closed at 4680, made a high of 4697, we have seen that the volumes in the market have increased and we may see some more increase in the volumes, but one thing is likely to be clear as we have said in our previous posts also, that nifty closing above 4730 levels can indicate a new bull run and we can make new highs all the way.

For the Trading session, which is 27th August, one can hunt on nifty according to this Map : -

Buy above 4690 - 4699 - 4708 - 4717 - 4728 SL - 4680

Sell below 4670 - 4660 - 4659 - 4640 - 4631 SL - 4682

We feel that the market trend would be flat and the expiry might be seen around 4655 levels, lets see what levels we close the expiry at, but if we close below 4620 levels then we may se some more downside and breaking 4580 would lead to a war between the bulls and the bears, so keep eagle eyes on Nifty now.

So one needs to be careful and trade in small quantity. One should also follow strict stop loss in there hunting.

We would like to wish all the Pirates a very all the BEST.

Disclaimer : -

The above stocks are my personal views, one may see that trading in the market involves risk and thus one may trade in the stocks at there own risk, we won't hold any responsibility.

Regards

Treasure Captain
www.moneybaghunting.blogspot.com

Tuesday, August 25, 2009

 Treasure Hunting Map (Commodities)

Hi Friends

The Map to hunt down on Commodities sector are as follows : -

Crude Oil

Buy above 3550 - 3577 - 3608 - 3649 SL - 3562

Sell below 3500 - 3495 -3444 - 3413 SL - 3515

Copper

Buy above 307 - 308.83 - 310 SL - 304

Sell below 305 - 303 - 300 SL - 308

Disclaimer : -

The above stocks are my personal views, one may see that trading in the market involves risk and thus one may trade in the stocks at there own risk, we won't hold any responsibility.

Regards

Treasure Captain
www.moneybaghunting.blogspot.com

 Treasure Hunting Map (Commodities)

Hi Friends

The Map to hunt down on Commodities sector are as follows : -

Crude Oil

 Treasure Hunting Map (Commodities)

Hi Friends

The Map to hunt down on Commodities sector are as follows : -

Crude Oil

Buy above

 Treasure Hunting (Stocks)

Hi Friends

The list of stocks which we have selected for the session are as follows : -

Reliance Industries

Buy above 2030 - 2053 - 2068 SL - 2018

Sell below 2005 - 1990 - 1976 SL - 2015

IVRCL INFRA

Buy above 369 - 372 - 375 SL - 365

Sell below 366 - 362 - 359 SL - 370

Rolta

Buy above 186 - 193 - 197 SL - 181

Sell below 180 - 176 - 172 SL - 183

These are the stock which we have short listed for the session and one can hunt these stocks in options and even in future, they can trade with appropriate stop loss and trade in the session.

Disclaimer : -

The above stocks are my personal views, one may see that trading in the market involves risk and thus one may trade in the stocks at there own risk, we won't hold any responsibility.

Regards

Treasure Captain
www.moneybaghunting.blogspot.com

 Treasure Hunting Map ( Nifty )

Hi Friends

Nifty made a low of 4582 and a high of 4672 in today's session, that clearly indicates that if we brake 4580 then a bull and bear fight is going to start again and this fight may drag market again, but if we cross over 4680 which can be a good level from the bulls to take over the command nifty can hit 4730 and if we are able to close above 4730 on closing basis that to with heavy volumes then nifty can make new all times highs and may not crack like all times.

If we look at the charts for nifty : -


Hunting Map for the session 26th August can be : -

Buy above 4665 - 4680 - 4694 - 4711 - 4728 SL - 4630

Sell below 4620 - 4612 - 4603 - 4580 - 4547 SL - 4638

If we look at the 20d moving average its just about to touch its high and a sell signal might generate at the higher end, which means and proves that 4730 can be tested on cards but a sell off may be seen at those levels and markets would be back to the range bound situation.

But one thing is clear and would like to make clear to you all, that a close above 4730 can touch 4900 and soon 5000 levels but a close below 4730 can make nifty again in an range bound situation and sell off may be seen at high levels, this rally may be due to expiry which is near to our pockets.

So one needs to be careful and trade in small quantity. One should also follow strict stop loss in there hunting.

We would like to wish all the Pirates a very all the BEST.

Disclaimer : -

The above stocks are my personal views, one may see that trading in the market involves risk and thus one may trade in the stocks at there own risk, we won't hold any responsibility.

Regards

Treasure Captain
www.moneybaghunting.blogspot.com

Monday, August 24, 2009

 Treasure Hunt Map ( Commodities )

Hi Friends,

We have started a new session were we would provide you calls on Commodities also as per we should have our hands open to all the areas thus the Treasure Hunting Map on commodities is as follows : -

Crude Oil (21st September)

Buy above 3630 - 3647 - 3660 SL - 3618

Sell Below 3595 - 3582 - 3563 SL - 3608


Copper ( 31st August )

Buy above 312 - 313.78 - 315.18 SL - 309.95

Sell below 308.53 - 307.13 - 305.20 SL - 310.20

Disclaimer : -

The above stocks are my personal views, one may see that trading in the market involves risk and thus one may trade in the stocks at there own risk, we won't hold any responsibility.

Regards

Treasure Captain


 Treasure Hunt Map ( Stocks )

Hi Friends

The stocks which we have short listed for 25th August are as follows : -

IVRCL INFRA

Buy above 373 - 382 - 387 SL - 365

Sell below 360 - 355 - 347 SL - 366

Reliance Industries

Buy above 1977 - 1987 - 1993 SL - 1970

Sell below 1961 - 1954 - 1945 SL - 1967

Unitech

Buy above 91.20 - 92.53 SL - 90.30

Sell below 89.87 - 88.93 SL - 90.50

These are the Treasure Bags which we have selected for your hunt, all the best to all the Pirates for the Hunt.

Disclaimer : -

The above stocks are my personal views, one may see that trading in the market involves risk and thus one may trade in the stocks at there own risk, we won't hold any responsibility.

Regards

Treasure Captain
www.moneybaghunting.blogspot.com

 Treasure Hunting On Nifty

Hi Friends

Nifty had broken 4350 levels many times, but on closing basis didn't close below 4350 levels and as said the levels were not broken and the fight between the bulls are the bears were again taken over, and in today's session we saw a clear break out above 4620 levels which was acting as a barrier for many trading sessions, and touched an high of 4656 and closed at 4642 in the end of the session.

As of now Dow is trading at 9560 levels, Europe was trading in green, Oil is trading at 74$ which is an all time high in the year 2009 since the starting.

Thus to cut it short if we see at the charts,


There is a buy zone around 4380 levels and a sell zone around 4730 levels, thus as we can see the expiry which is near to our bags, we saw some panic short covering which lead the pattern to change and a buy signal was generated and thus we saw an impressive session in today's session.

We might see some profit booking around 4730, we saw volumes in today's session, but if we are able to brake 4730 levels with volumes we can see a clear bull run and the fight between the bulls and the bears might end and we might get to see the control in the hands of the bulls and we can thus touch an high of 4900 levels soon.

As of now make a note at 4350 and 4730 levels, and for the hunting strategy for 25th August is : -

Buy nifty above 4650 - 4670 - 4687 - 4709 - 4730 SL - 4620

Sell below 4612 - 4590 - 4567 - 4530 - 4492 - 4470 SL - 4628

As per we are near to expiry we might see more of volatility, thus we advice you to trade in small quantity and trade with strict stop loss.

We are also live at www.moneybaghunting.blogspot.com, so for any queries one can contact us there.

Do check our performance report for the session after the session, and do check out our list of hot stocks which can make you grow more rich.

Its on the way.

We would like to wish all the Pirates a very all the BEST.

Disclaimer : -

The above stocks are my personal views, one may see that trading in the market involves risk and thus one may trade in the stocks at there own risk, we won't hold any responsibility.

Regards

Treasure Captain
www.moneybaghunting.blogspot.com

Monday, August 17, 2009

 Treasure Hunt Map ( STOCKS )

Hi Friends

After a major reddish market, we have still been able to make money.

Will cut it short and here is the list of Stocks to trade : -

Reliance Industries

Buy above 1975 - 1992 - 2018 SL - 1967

Sell below 1958 - 1933 - 1907 SL - 1965

Allied Digital Services Limited

Buy above 452 - 470 - 489 SL - 447

Sell below 440 - 430 - 408 SL - 445

Ivrcl Infra

Buy above 305 - 308 - 313 SL - 300

Sell below 297 - 293 - 290 SL - 303

These are the Treasure Bags which we have selected for your hunt, all the best to all the Pirates for the Hunt.

Disclaimer : -

The above stocks are my personal views, one may see that trading in the market involves risk and thus one may trade in the stocks at there own risk, we won't hold any responsibility.

Regards

Treasure Captain

 Treasure Hunting Map On Nifty

Hi Friends

If you see our previous post, you must have noticed that if we brake most important levels, we can test 4380 levels, and if we check out the low for todays session, its low was 4387.

We gained in the red market also, it doesn't matter if we are green or red, if we trade with the air we will win always and here was the result in front of you.

Treasure Hunt for the session 18th August is : -

Firstly we would like to show you a chart, which can brief you more on the market trend and the danger which has formed, this time the fight between the bulls and the bears might get over for tomorrow and bears may take over the ground and we may see some bearish zones in the market.

The chart is as follows for nifty : -


Nifty has formed a mountain, which shows the fight between the bulls and the bears, as one can see the fight as of now between the bulls and bears is over, when we trade over 4420 levels we may get a round of fight between the two once again and for the bull run to continue we have to close above 4730 levels, but as of now for tomorrow most important levels to see is 4360, which once broken can make full control in the hands of the bears and we may test 4100 levels also, after which we may decide is any chance of reversal or we are heading to that gap fill which we had warned you before also in our previous articles.

There are many Winners and losers in the gamble, but if we count on numbers then there would be few winners and the number of losers would be more than the winners, thats why if you have to win the game one has to think and play with eagle eyes, the one who can win can also lose but hunting with stop loss can make you catch your destiny.

So follow the air but run ahead of time.

The hunting map is : -

Buy nifty above 4450 - 4483 - 4519 - 4540 - 4580 SL - 4420

Sell nifty below 4370 - 4350 - 4315 - 4279 - 4242 SL - 4405


Nifty has formed a mountain and the trend in currently down side, crude oil and world markets have shown some correction, our markets were in a range bound situation and we were not able to cross 4730 levels to continue the control for the bulls as per we were low in volumes, now that we are slipping again, we might see some more downside and the downside can be a range bound situation and this time when we bounce back, we would have to have volumes in the market as per the major draggier for the market was low on volumes, this time the volumes would have to increase other wise the gate wont open.

Hope all enjoyed our bags of gold and followed our map and made a successful hunt.

Rock on Pirates, here we start yet again another HUNT.

Disclaimer : -

The above mentioned information are my personal views and the above mentioned information is for educational purpose only, one who is following the information in there hunts are trading at there own risk, we wont hold any responsibility.

Regards

Captain Treasure

Sunday, August 16, 2009

 Treasure Hunting On Stocks

Hi Friends

The stocks to hunt down in the treasure hunt are short listed below : -

Reliance Industries

Buy above 2042 - 2050 - 2064 SL - 2035

Sell below 2030 - 2021 - 2007 SL - 2037

IVRCL INFRA

Buy above 321 - 323 - 327 - 331 SL - 318

Sell below 318 - 316 - 311 - 308 SL - 321

Bharti Airtel

Buy above 411 - 413 - 415 - 418 SL - 409

Sell below 408 - 406 - 404 - 401 SL - 411

Unitech

Buy above 93.50 - 94.23 - 94.93 SL - 92.70

Sell below 92.53 - 91.53 - 90.83 SL - 93.10

Reliance Infrastructure

Buy above 1185 - 1197 - 1210 - 1221 SL - 1178

Sell below 1173 - 1161 - 1147 - 1134 SL - 1181

These are the list of the stocks, one has to follow strict stop loss and trade as per the trend in the market, one has to keep in mind that trading in the stock market involves high risk, thus they are trading at there own risk and the stair case to performance is to trade on time as per the trend and with SL, so trade at your own risk and hope you win the golden bags.

Regards

Captain Treasure

 Treasure Hunting Map for Nifty

Hello Friends

So all are set for another treasure hunt which is going to rock once again.

Wont take much time and brief upon the market, so if we see the Friday session, nifty has given a close at 4580.05, which is a nice close but a war between the bulls and the bears is still on.

Treasure Map for nifty for the coming session which is 17 of August is : -

Once we would like you to show the Chart which can give you an whole brief upon the game and how to perform and take steps accordingly.


If we look at the charts, it shows that we are low at volumes and for the bull run we have to close above 4730 levels and the fight between the bulls and bears would be over only when we close above 4620 levels where after the bulls become more strong, but on the down side bears may take over if we brake 4550 levels we may test 4480 levels and if that support is broken then we may test 4444 and 4380 levels where the bears are more stronger and the bulls become more week.

If we look at the map one can buy nifty above 4590 - 4599 - 4612 - 4630 - 4650 SL 4575

Sell nifty below 4570 - 4553 - 4539 - 4526 - 4510 SL - 4580

The nest day session would be decided upon the closing bell on the charts, as of now we see a bearish move, and as we had seen some downside all of a sudden in the last hours, we may see some downside, but the fight will still go on between the bulls and the bears.

So trade with Strict Stop Loss and timing is everything. start booking profits at high levels and buy at any dips when we see some correction, start selling in small quantity selling in the sense book profits and start accumulating bags at any dips.

Disclaimer : -

The above mentioned information are my personal views, one may trade at there own risk.

Saturday, August 15, 2009

 A Glance at the Hunt

Hi Friends,

Have been out of the hunt for a time being and sorry couldn't update upon the hunting strategies, so here we are again to rock on and carry on the hunt and this time hunt down in bags.

In the last session which was on the 14th of August 2009, our Indian Treasure Hunt was a choppy session, where we touched an high of 4619.00 and a low of 4580.05 and thus in the end of the day the session settled at 4580.05 levels.

Nifty was trading in Premium which showed some panic short covering in the session which ended a day before the 14th, but we still were not confirmed on the up side as per the bulls and bears are still at a fight, the bulls would take full control only after a successful close above 4620 levels, and the bull run to continue nifty and the bulls have to close with high volumes above 4730 levels, then only in the near future we can see 4900 or 5000 levels.

But after the choppiness and the close below 4620 levels confirms that the fight between the bears and the bulls are going to continue and and can see some downside in the market, as per the global cues if we see : -

When European Market had opened during the Indian markets, there were trading in green and in the end session all the markets are in red,

And if we see at the American Market, Dow also saw some correction and in the end it recovered from its low and closed in red.


If we see the Asia closing for the session they closed in green but a flat close was seen in hang sang and nikkie closed at green signal.

If we look at the commodities section, crude oil is showing some profit booking and trading at 67.51 $, if it takes support around 66$ and bounces back then it can again touch 71$ and be in the range of 66 - 71$, but any side break out can boom or crash the market, it clearly depends on the side break out it gets.

Thus for the up coming sessions we may see some dips, which can be an oppurtunity to buy as per we are still under a war with the bears and the bulls, its not a bull market its nor a bear market, its just a fight and a mix market, thus grab this oppurtunity and start collecting in small quantity at dips and sell when the bulls take over, its like bears signal is a buy and bull signal is a sell.

Trade with open eyes, and monsoon was a major hammer for the market and the GDP ratio, but god has helped and blessed us and thus we are enjoying the falls of water drop lets, thus the hunt becomes more interesting as per a complete bear or a bull run is that much hard to understand, so don't miss the opportunity and see the markets all around and hunt.

The above views are my personal information and my personal studies, one can use the information as an educational purpose and trade with there own responsibilities. We hold no responsibility for any losses or profits. They are using and hunting at there own risk.